Education and Social Development
Spring 2021
The City College of New York
Instructor: Juliana de Castro Galvao
e-mail: [email protected]
Slack: You can also send me a private direct message (dm) through Slack
Office hours: Mondays 09:30am - 10:45am
              By appointment
                *Please sign up by Sunday
                 * Spreadsheets to sign up will be sent every week through Slack
Class Meetings: Wednesdays 09:30am - 10:45am
                Blackboard Collaborate Ultra
Course Overview
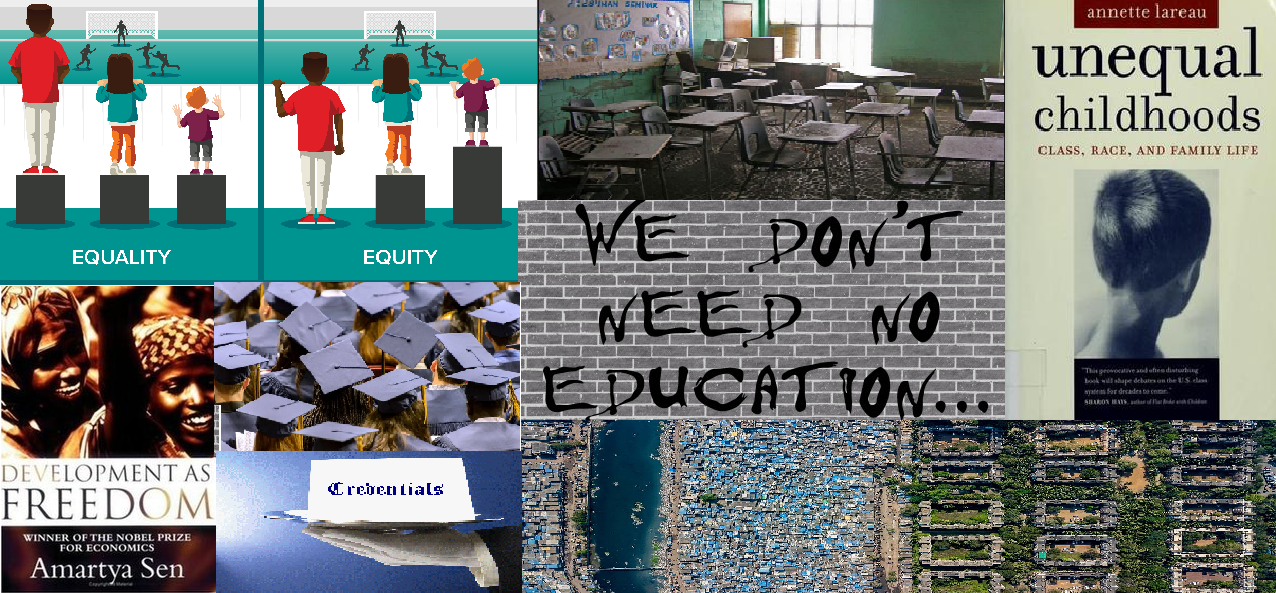
Education is commonly viewed as a necessary condition for social development. However, social development is also essential for promoting education, both in terms of quantity and quality. This course will compare educational and social development across countries, emphasizing how each impacts the other. It will examine why education is considered a necessary though not sufficient condition for social development. It will also consider how social development can influence opportunities for formal education in many societies. The course will consider theoretical, methodological and empirical aspects of social stratification studies, particularly in the fields of sociology of education and social development.
Requirements
Each student should carefully read the required readings of the week, being sure to summarize their main aspects and list concepts that are not clear.
The course has a medium reading load (approximately 50 pages per week).
Distance Learning Platforms
We will be mainly using three digital platforms:
- Blackboard
- Assignments and Exams
- Online Meetings (Blackboard Collaborate Ultra Wednesday 09:30-10:45am)
- Course Website
- Weekly Lecture Posts (Posted on Wednesday)
- Where students will post answers to weekly lecture post questions and ask questions related to the weekly readings (by Sunday)
- Slack
- General Communication
- You should register for Slack using the invitation sent to your e-mail registered on Blackboard
- I recommend you download the Slack app on your phones if possible
- Zoom
- Individual Office Hours
- Students will receive a spreadsheet weekly with time-slots for office-hours which happen every Monday from 09:30 – 10:45
- If you wish to attend office hours you must sign up by Sunday
Summary of Weekly Schedule:
- Lecture Posts will be uploaded on Wednesdays on our course website
- You should answer the questions to the lecture posts by Sunday
- Mondays – office hours from 09:30am-10:45am (by appointment)
- Assignments will be due on Mondays – unless otherwise noted.
- On Wednesday: Your internet connection allowing, participate of our meeting on Blackboard Collaborate Ultra (09:30am-10:45am) where we will discuss your questions, doubts, go over assignments and main concepts.
- These are not mandatory, but are highly encouraged.
- These will count as extra participation points (up to 10 extra points) – provided there is active engagement from the student (Read more below)
Assignments and Grading
Grading will be distributed as following (for a total of 100 points):
- Participation: 30 points
- How will participation be assessed?
- You must answer the questions asked in the weekly lecture post on our course website.
- Your answer should engage with the readings for that week and not only the lecture post. You should also ask questions related to the readings and the lecture posts. When possible, you should engage with your classmates’ comments and answers.
- How will participation be assessed?
- Your comment should be at least 100 words
- Your answer should be posted on the course website in the comments section of the lecture post by Sunday
- Please write your answer in a safe place and save it before posting, to guarantee you will not lose your work. In previous semesters we have had issues with the comments section on the website.
- We will have a total of 11 lecture posts. Comments in the lecture post are worth 3 points. This means you can skip one lecture post without any grade penalty. In case you do answer all 11, you will get 3 points as extra-credit.
- Extra-points for participation (up to 10 extra points) will be conferred to students that have an active participation during our Wednesday virtual meetings – through Blackboard Ultra Collaborate.
- What is active participation? Students that prepare questions and engage in debate.
- If you are just logged in during our Blackboard Collaborate Ultra session, but do not participate (be it by speaking or writing in the chat) during our meetings this will not be counted as you being in the session.
- Take-home assignments: 15 points
- There will be three take-home assignments throughout the semester (each will be worth 05 points)
- They must be sent through Blackboard on Monday– the exact due dates are marked in our course calendar.
- Quiz: 10 points
- Midterm: 20 points
- Final Exam: 25 points
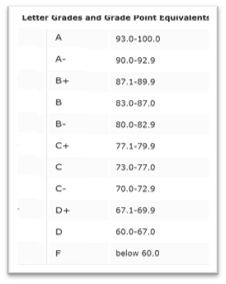
Find below the equivalence between grade points and letter grades
Accessibility and Accommodations
Important: if you believe the design of the course or classroom poses any type of barrier or difficulty towards your learning experience, please contact me as soon as possible so that we can work out the necessary arrangements.
Please…
Organize your schedule to keep up with the readings. Some texts may require more time to read than the regular reading load of the course. Lecture posts are organized presuming that the students have read the required readings for that week beforehand.
Note that I cannot accept assignments past the due date without justification. A penalty of 1 point will be deducted for each day past the due date for any given assignment.
Be advised that plagiarism will be taken very seriously and will result in severe penalties. For more information on academic dishonesty click HERE
Recommendations
I strongly recommend you use some type of reference and citation management tool, such as Zotero, Mendeley, Endnote. I also recommend you use some type of cloud storage (Google Drive, One Drive, Dropbox).
Course Calendar
Week 1 – Introduction and Basic Concepts
February 01 – February 10
Sen, Amartya. 1981. “Chapter 2: Concepts of Poverty” In: Poverty and Famines: An Essay on Entitlement and Deprivation. Oxford: Clarendon Press.
Week 2 – Poverty and Capabilities
February 11 – February 17
Sen, Amartya. 1999. “Development as Freedom.” Oxford University Press: New York (Introduction and Chapter 1)
Aber, J. Lawrence, Bennett, Neil G. Conley, Dalton C. Li, Jiali. 1997. The Effects of Poverty on Child Health and Development. Annual Review of Public Health. 18(1): 463-483
Week 3 – Development and Education – What is the relationship?
February 18 – February 24
Chabbott, Colette. Ramirez, Francisco O. 2006. “Chapter 7 – Development and Education.” In: Sociology of Education at the Threshold of the Twenty-first Century, edited by Maureen T. Hallinan. 163 – 188
World Development Report 2018: Learning to Realize Education’s Promise Published: October 2017. Washington, DC: World Bank
(Chapter 1: Schooling, learning, and the promise of education: Pages: 37 – 54)
Week 4 – Economic and Educational Mobility – A Global Perspective
February 25 – March 3
Narayan, Ambar, Roy Van der Weide, et al. 2018. “Fair Progress? Economic Mobility across Generations around the World.” Washington, DC: World Bank.
(Overview: pages 1 – 43)
First Assignment Due Monday (March 01)
Week 5 – Quiz
March 04 – March 10
Quiz Posted on March 3 (Wednesday)
Quiz due March 08 (Monday)
Week 6 – The Forms of Capital
March 11 – March 17
Bourdieu, Pierre. 1986. “The forms of capital. In J. Richardson (Ed.) Handbook of Theory and Research for the Sociology of Education.” (New York, Greenwood), 241-258.
Coleman, James. 1988. “Social Capital and the Creation of Human Capital” American Journal of Sociology. 94: 95-120.
Second Assignment Due Monday (March 15)
Week 7 – Midterm
March 18 – March 24
Midterm posted on March 17 (Wednesday)
Midterm due March 24 (Wednesday)
Week 8 – Spring Recess
March 27 – April 04
SPRING RECESS
Week 9 – The Coleman Report
April 05 – April 14
Downey, Douglas B. and Dennis J. Condron. 2016. “Fifty Years since the Coleman Report: Rethinking the Relationship between Schools and Inequality.” Sociology of Education 89(3):207–20.
Hanushek, Eric A. 2016. What Matters for Achievement: Updating Coleman on the Influence of Families and Schools. Education Next: 22 – 30.
Week 10 – Disadvantages at the Starting Gate – Inequalities Between and Within Families
April 15 – April 21
Heckman, James J. 2008. “Schools, Skills, and Synapses.” Economic Inquiry 46 (3): 289–324.
Marteleto, Leticia.J. & Dondero, Molly. 2016. “Racial Inequality in Education in Brazil: A Twins Fixed-Effects Approach” Demography 73(4): 1185–1205.
Week 11 – Race, Class and Education – Inequalities Between and Within Families
April 22 – April 28
Annette Lareau.. 2002. “Invisible Inequality: Social Class and Childrearing in Black Families and White Families.” American Sociological Review 67:747-76.
Calarco, Jessica McCrory. 2014 “Coached for the Classroom: Parents’ Cultural Transmission and Children’s Reproduction of Educational Inequalities.” American Sociological Review 79(5): 1015–37.
Week 12 – Education and the (Re)production of Inequalities
April 29 – May 05
Raftery, Adrian E., and Michael Hout. 1993. “Maximally Maintained Inequality: Educational Stratification in Ireland.” Sociology of Education, 66, 1: 41-62.
Lucas, Samuel. 2001. “Effectively Maintained Inequality: Education Transitions, Track Mobility, and Social Background Effects.” American Journal of Sociology 106:1642-90.
Third Assignment Due Monday (May 03)
Week 13 – Horizontal Stratification in Higher Education
May 06 – May 12
Gerber, Theodore, and Sin Yi Cheung. 2008. “Horizontal Stratification in Postsecondary Education: Forms, Explanations, and Implications.” Annual Review of Sociology 34:299–318.
Torche, Florencia. 2011. “Is a College Degree Still the Great Equalizer? Intergenerational Mobility across Levels of Schooling in the United States” American Journal of Sociology 117(3): 763-807.
Week 14 – Horizontal Stratification in Higher Education
May 13 – May 16
Banerjee, Abhijit and Esther Duflo. 2012. “Chapter 4 – Top of the Class” In: Poor Economics : A Radical Rethinking of the Way to Fight Global Poverty. New York, UNITED STATES: Public Affairs.
Buchmann, Claudia. Hannum, Emily. 2001. “Education and stratification in developing countries a review of Theories and Research..” Annual Review of Sociology. 27: 77-102
Week 15 – Final Exam
May 17 – May 22
Final Exam (posted on Monday May 17)
Final Exam due May 22 (Saturday)

This entry is licensed under a Creative Commons Attribution-NonCommercial-ShareAlike 4.0 International license.
Good morning everyone,
1) I felt that the PowerPoint was very informative, I usually have a hard time reading certain graphs but I think you did a great job explaining it to us and how to actually read and understand. I would maybe suggest having a few examples of what you’re trying to explain instead of quotes, I just had a hard time understanding what some of them actually meant, but that’s just me. I would also appreciate more videos on the topics.
2) I found chapter 2 on the concepts of poverty very informative, I was able to learn about some of the different approaches to understanding poverty, some that stood out to me were the biological and inequality approaches. The value of judgment, common standards for comparisons between communities and the relative scaling of deprivation as a means of aggregation is what I wrote down to be able to learn more about and understand it better. Hopefully we will be able to learn more about that in class.
3) PPP is purchasing power parity and it measures the total amount of goods and services that a country currency purchases in another country. It also allows for economists to compare economic productivity and standards of living between countries. Using PPP to convert income data to a common currency is a better way to make international comparisons because it compensates for the differential costs of living so that’s probably why researches prefer using PPP.
4) Reading the two page PDF, it was very informative, I can agree and see how much poverty has changed over the years and how the U.S society and our economy has influenced the poverty measures in such a negative way. There were 6 points that I have heard about before and some that I never knew about so learning about them were very informative. I can also agree that the poverty lines needs to make sense and be acceptable to the public.
5) Watching the video, I learned that the problem isn’t the war on poverty, but what is actually happening with our economy in the last few decades. It’s interesting to see how they measure poverty through earnings, rent, and government benefits. Also, seeing the percentage living in poor households around the world, and how other countries market income are high but countries with low disposable after tax income is due to the fact that they do more for poor people than we do here in the U.S. I can agree that we need to find more jobs and help the poor more to be able to fix poverty.
I found the Power Presentation to be very helpful especially after reading both articles. I found that it helped me better understand the concepts as well as clarifying any thoughts and concerns that I had in regard to the reading. The presentation taught me that poverty does not equal inequality, instead it taught be that poverty equals to deprivation of certain basic needs for survival or development.
Both readings were well written and very informative, they read well and were very thought provoking. After reading “The Effects of Poverty on Child Health and Development,” I learned that being poor can mean a variety of things. For example, it can consist of unemployment, divorce, being a minority or even the neighborhood that you live in. I really liked how this article focused on how poverty can influence the development of children and how it can create a stress load on individuals, due to their financial insecurity and unemployment. Another thing that I found quite interesting about this article was that it shined light on the fact that poverty means different things for individuals especially when comparing whites and blacks. The article mentioned that for white’s poverty is based on family income while for blacks it’s based on low maternal education. Lastly, the article also stated that even though studies have shown that poverty does negatively impact child health and development there is no clear way that poverty can be operationalized.
Amartya Sen’s article, “Development as Freedom,” focused on the idea that individual freedom is what can cause social change. That was the focal point of this article and it taught me that there is a huge inequality in this country due to the lack of freedom it provides such as economic opportunities. Sen’s article had similar ideas as to the first article in that African Americans are deprived of certain basic needs when compared to white individuals. One of his biggest concerns was that the U.S. is a rich country that has so much room to grow and help lower the inequalities that it faces.
Sen’s interview also focused on individual freedom as well as the impact that it has on a country. Sen stated that individual freedom is conditional to certain opportunities such as political and social. One of the examples that Sen provided about inequality of basic freedom was the lack of healthcare and insurance that is found in this country despite it being a rich and resourceful country. The video also mentioned that due to the lack of insurance and healthcare there is a low life expectancy of African Americans. I find this to be concerning because that can be changed if the country would acknowledge this problem and provide better healthcare and insurance to those who need it.
Both videos were very informative, and the first video helped me understand the different types of poverty that are known such as multidimensional poverty. The first video explained how this type of poverty is considered the deprivation that children have on basic needs and that this type of poverty is worse in comparison to income poverty. The second video also focused on the different kinds of poverty, but it wasn’t as severe as the first video. For example, it talked about poverty below the poverty line which doesn’t include malnourishment or proper education instead it shows how a bad living environment is a form of poverty but not multidimensional poverty.
1. The presentation was very clear. The graphs of slide 18 make me wonder how much the US spends on education compared to other rich countries? We often hear a lot of criticism on how the US spends so much money on defense and its military compared to education. I also found the slide on mobility and colleges really interesting and it reminded me of college mobility study on the NY Times. That study place City College number 1 on its overall mobility index for public colleges and number 2 among all colleges. (https://www.nytimes.com/interactive/projects/college-mobility/city-college-of-new-york).
2. The reading was clear and the data that it provided was really interesting. It was nice to see all the data on the correlation between intergenerational mobility and education, especially considering that one of the reasons why my family immigrated was so that my siblings and I could get a better education. The reading mentioned the practice of “tracking” when talking about education reform and the footnotes explains it a bit, but I don’t see how tracking can be a bad thing.
3. The video talks about some of the important current trends in social mobility. He talks about how mobility in the US is actually stable and so kids born in the 70s vs kids born in the 90s have almost the same chances of moving up in the income distribution. However, this is not necessarily good, since US social mobility is lower than most other developed countries. He also explains that there is more variation in social mobility within the United States than across countries. Some of this variation is due to large regional variation and so mobility can be much lower in urban areas than rural areas. Five predictors of low social mobility in the US are segregation, income inequality, quality of public schools, strength of social network and family structure.
4. The Crash Course video defines the different types of social mobility and discusses some of the trends in the US. She explains that in absolute terms, the long trend shows that social mobility is higher mainly due to industrialization. However, since the 1970 there has been unequal growth in income which has resulted in a decline in social mobility and with a single generation, social mobility is stagnant. There are also other factors such as race, ethnicity, gender and education. White American see higher rates of social mobility, while Black Americans have higher rates of downward mobility. Women as a whole have experienced absolute mobility, but there are still gaps especially for women at the bottom of the income distribution who are more likely to stay there than men.
1. From my PowerPoint presentation, what still isn’t very clear? Any questions, thoughts or comments you would like to share?
The presentation was very clear but something about relative and absolute mobility is becoming more difficult to understand. After reading the passages and listening to the videos I feel like there a lot of forms of definition, but none really make sense to me. I also wondered with mobility how much does single parent household affect it. I believe single parent households have increased in the last 50 years, so do children experience less mobility? Does a single parent with better education still uphold more mobility than two parents that have low income and less education levels? Or does a single parent with low income have an increased mobility rate then two low-income parents?
2. From the Fair Progress reading are all concepts, measurements and ideas clear?
Like stated before id like a better understanding of the difference in absolute and relative mobility, I understand the importance and get the idea of what it measures but how is it being measured? I liked the fact that mobility and the article see the importance of targeting equality in prenatal and utero development since it all has an impact in a mother’s stability and can holds cognitive development. Also, we know the impact of policies and I think everyone gets the idea of how we can improve mobility for all but there is just something more powerful that always leads the other way. The idea of hierarchal power and domination will not allow policies like equal education, better health insurance, and other to rise in our society.
3. Summarize the main conclusions from the Raj Chetty video. Do you have any questions?
The main conclusion is that there is large regional distribution of mobility and very limited to less than 20% of opportunity. The video mentions that Urban areas have lower rates of mobility than rural areas which I found surprising due to urban areas having more labor oppurtuities. Raj Chetty concludes that there are five predictors to mobility such as segregation, income inequality, quality of public schools, strength of social networks and fraction of single parents. At the beginning of the video, he mentioned big data and its contribution to statistics and such. Amazon and google and other platforms such as facebook are always controvertialized due to this, and im thinking about the impact of the data collected and am now questionable about the ethics vs the impact it has had on our society.
4. Summarize the main takeaways from the crash course video. Are all concepts clear?
My takeaways from the video were the definitions of intergenerational and intragenerational mobility as well as absolute and relative mobility. Also, the trends of social mobility and the impacts that that social economic status has a huge, but it is also interlapped with identities, such as gender, race and educational level. It spoke about trends in social mobility and how it creates different opportunites. I found the distinction of a single mother houselold lowering the mobility rates interesting. Not only because being a single mother is hard but women in general are always a target to inequality in the labor market. During the poewerpoint I questioned the impact of single parent households and the video very broadly answered my curiosity that marriage has a positive impact of mobility to the double income contribution, but what about when only one parent has an impact, is it the same rate of mobility as a single parent household or are other factors also contributing.
1) The question of what matters most for student achievement, if schools or families is so interesting and complicated. I think it’s so hard to answer because both are very much connected, the socioeconomic status of your family affects what kind of school you go to and the opportunities to which you have access, but at the same time the socioeconomic background of your family (and the schools they attended) is affected by many things like inequality. That relates of what to the other question of what the relationship of schools and inequality is, which is also very complicated. Schools attempt to teach students the knowledge and skills that can help people experience upward mobility, but it also reproduces inequalities like most, if not all, institutions.
2) The ideas and concepts from the reading were clear. I think both readings highlight why it is so complicated to answer what is the relationship between schools and inequality, but what is clear is that education in the US has a lot of inequality that remains to be solved, whether that is worse than inequality produced in non-school environment should not be the question in my opinion.
3) The first video focused on what has changed since the Coleman Report. They explain that Coleman found large racial disparities between students’ achievement and they found that while this achievement gap has closed it has done so very slowly, and at this rate it will take more two centuries to close that gap in some subjects. They also explain that schools do have effect in closing this gap and that effective teachers plays a big role in that. The Crash Course video explains how the educational system can both cause and perpetuate class inequalities. She explains that wealthy kids live in more wealthy neighborhoods that fund their schools better, and this translates into better schools with more resources. Studies have found that increases in school funding results in higher earnings for students as adults. However, school funding does not account for all the inequalities in the system. Families also play a big role in how well students perform in school (ex: working class parents have less time to read to their kids).
4) I believe that education is important and can help individuals experience social mobility and do better than their parents. However, I still believe that schools reproduce inequalities. The educational system is reproducing the racism, classism, and sexism that we see in society. We just have too look at which schools get the most funding, which students are given the most opportunities and the who are the current educational practices benefitting the most. I think that a lot of what schools and its practices have to offer sound very good at first glance, but once we look at who benefits the most from these then we see a reflection of the same inequalities that we criticize out of schools.
1.The life course perspective suggests that as students age they are less dependent on their parents economically and socially. Therefore, social background has less of an influence on individuals who wish to continue schooling. Although, this is how it should be, this isn’t true in the United States. In the US, FAFSA centers around parental finances which may or may not benefit the student. I think this relates back to a chart we analyzed earlier in the semester where in countries with higher rates of inequality, an individual’s socio-economic status was more affected by that of their parents. Unfortunately, because college isn’t free in the United States, the financial aid a student receives is more dependent on the income, wealth and assets of their parents. In contrast, there is more independence when it comes to high schools because secondary school is more universal unless it’s private. Even so, inequality persists because secondary schools vary in quality.
2.The main takeaway from Raffery and Hout’s reading is the theory of Maximum Maintained Inequality. In my own words, the MMI suggests that if secondary education is a luxury all upper class individuals are able to take advantage of, then it will become accessible to all of their counterparts. However, the MMI doesn’t account for the limit when creating policies to decrease inequality. For example, in 1967 in Ireland secondary schools became tuition free and entrance exams were still in place but didn’t affect admission. This means that secondary education became more accessible to the lower class. Nonetheless, not everyone was able to take advantage of the opportunity because some families needed their children to find employment and contribute to the household income. As for the wealthier classes, they either received better quality secondary education (which some might’ve paid for) or continued on to tertiary education. In conclusion, although the educational gap between social classes was narrowed, it wasn’t completely erased because of the advantages the upper classes already possessed. Lower class families prove to be limited by their socio-economic status to fully benefit from opportunities granted to them. This is known as the rational-choice explanation.This is also evident today in the United States. For example, even at university level, students who come from low-income families may work after school to provide for themselves and their families. Whereas, students who come from middle and higher class families may participate in internships, join clubs and sports teams ,etc. These activities are perceived to be more beneficial to the student because it helps them develop skills, gain experience and expand their social and cultural capital that will give them an advantage later on in their careers. Therefore, although students can graduate from the same school with the same degree, the rate of return isn’t equal depending on how the student’s socio-economic status influences their decisions.
3. In Lucas’ reading the main theme is the Effectively Maintained Inequality. My understanding of the EMI is that there will always exist a degree of inequality. As described above, students of different social classes may attend the same college but not utilize the resources in the same way. So while an upper class student develops relationships with school staff and future employers, the lower class students may not be able to do the same depending on their circumstances.
4. In the Slowdown in Higher Education, Michael Hout stresses that a college education is a driver of economic and national success in the knowledge economy. Although the US led the world in college graduation, rates have fallen since the 1970s. According to Hout, only half of college students who start college, graduate with a degree. To find a reason for low college graduation rates, researchers have tried to find a connection between high school preparation and college graduation rates. Ironically, students are more prepared for college now than ever before. In 2009, Obama expressed his desire to have half of America’s college students graduate. Nonetheless, Hout argues that colleges lack the capacity to have the ability to do so. In an article titled The Cohort Squeeze, researchers found that the higher the population of 18-20 year olds, the less people earn college degrees. Although the amount of college degrees stays the same, the rate doesn’t when the population shifts. Hout has discovered that across the country college admission rates are falling. Students who fall in the middle of the ability pool are able to have higher rates of return from a college degree. The idea of endowment is introduced in the video and is defined as the resources that colleges and universities can incorporate into the academic experience of their students to better prepare them for their careers. Although college tuition rates have increased, they are financially unable to provide services to ensure the success of all their students.
From my PowerPoint presentation, what still isn’t very clear? Any questions, thoughts, or comments you would like to share? I found the Powerpoint presentation to be clear to me. Due to some prior knowledge, I found the connection between the education system between Ireland and the United States to be quite interesting. In fact, it still shocks me to this day how college is free or practically free in Ireland compared to the U.S and yet Ireland’s education is better.
From the Raftery and Hout (1993) readings are all concepts and ideas clear? From the Raftery and Hout readings, all concepts were somewhat clear to me, I found the understanding parts of the readings regarding the charts was hard for me to understand even after the powerpoint as well kind of difficult at times due too. I understood the Irish educational system and what it stood for educationally as well as the 1967 reforms.
From the Lucas (2001) reading are all concepts and ideas clear? All concepts and ideas from the Lucas readings were hard to connect for me personally due to the length of the reading. I was able to pick apart ideas regarding inequalities and social origin in children. I also understood how important social background could have on a child’s growth and a better chance at successfully finishing school.
Summarize the main takeaways from the video. Some of the main takeaways from the video consist of education’s knowledge economy and pace at which secondary schooling declined and drop out rates. College preparation has increased over the years. However, there still seems to be high dropout rates which bring out the question of whether it’s the students or the school’s fault for this. College in fact lacks the capacity to teach half the youth which is surprising knowing how much college is promoted. The video is challenging colleges’ negatives that students face, like loans which support the causes for increasing dropout rates. If America doesn’t have enough funds to equip students with the right education, society will fail to keep up economically.